Projecting Target Field 2010: Part 3
Part 1 and the more boring part 2. I get it, weather is only exciting the first time.
Concluding the series, I have some insights about that lack of foul territory. Gameday conveniently has hit location data available for every ball in play. Unfortunately it does not note whether a ball was foul or fair, nor the number of pitches in the plate appearance. Gives me something to do I suppose.
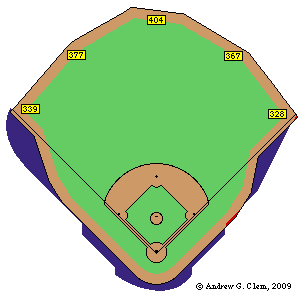
Colors are mostly self-explanatory. Purple is foul territory unique to Mall of America Field the Metrodome and red are the two tiny slivers unique to Target Field. After converting the coordinate system to something more tractable (woo, I rock at trig because of this series), I was able to separate the foul outs from fair.
Some numbers:
| Event | Number | Pitches Per Event |
|---|---|---|
| All PA | 18739 | 3.758 |
| All PA (home team) | 9236 | 3.812 |
| All PA (away team) | 9503 | 3.705 |
| Foul out | 455 | 3.455 |
| All PA (not foul) | 18284 | 3.765 |
I split apart home and away results in case there was some bias from familiarity of the Dome by the Twins. Turns out there might be. Away teams had shorter plate appearances, ball in play or not. Not entirely sure why. Non-BIP plate appearances were much closer in length (4.57 versus 4.54) while BIP plate appearances had a greater delta: 3.47 compared to 3.33. I suspect the former is just random variation (a bit less than 3000 events each for home and away) while the latter is due to the Twins’ fielders having more familiarity with the quirks of the field.
For foul outs, I ignored foul bunts. Since those are dependent on the stupidity of the batter and not any park, I opted to not count them. To determine whether an out was foul or not, I relied upon the description given to me by Gameday. Relying on trig failed since the point recorded is where the ball was fielded, not where it landed. So I had several foul doubles and triples until I changed my method.
Here are the results of whether a foul ball would remain catchable or not in Target Field.
| Event | Number | Pitches | Pitches Per Event |
|---|---|---|---|
| Still catchable | 292 | 1033 | 3.538 |
| In the seats | 163 | 539 | 3.307 |
The method I used to estimate catchability is rather crude, but should provide a ballpark estimate. Not a very large number of events. Maybe I should have crunched 2005-2009, though I think I really need ten years or more worth of data to get a decent sample size.
Anyway. We can start by assuming a worst case scenario that those 163 foul outs no longer end in a foul out. So, we have 3.765 pitches per plate appearance instead of 3.307, for ~77 more pitches in total. Over three years. There were 12,929 BIPs (loosely using “play” here) over the three years, resulting in ~37 more BIPs per year. If we instead assume that some percentage of these foul outs will still end in a foul out, but with a lower probability, then ~1-2 will end in a foul out with the other 35-36 a BIP.
But, at least one and probably a few more of those former foul outs would/could be home runs instead. If the wind was blowing out, definitely home run. Blowing in, not a home run. I recorded 459 home runs over the three years, for a rate of 0.0245 HR/PA. Multiplying by 163 and we have one PA ending in a home run instead of an out per year. Not something to worry about.
While the decreased amount of foul territory will increase the run environment of the field slightly, the majority of foul territory in the Metrodome remains for Target Field. Eye-balling the purple in the diagram above I would guess two-thirds of the foul territory remains; a number backed up by the percentage of foul balls still catchable. Finally, most important are the fence distances and wind patterns of the field, both of which favor Target Field to suppress the run environment. I think Target Field could very well be the AL version of Petco.
Again, much thanks to Andrew Clem for his meticulously drawn fields. This simply would not have been possible without his work.