Projecting Target Field 2010: Part 1
Target Field, with its apparently closer fences and limited foul territory, would project to have a higher run environment than the Dome, if all things were the same. But, we have weather to deal with now.
Now, I cannot project how the infield will play, or how bouncy outfield walls are, or Gardy asking for the dirt in front of the plate packed down to resurrect the Baltimore Chop. However, I can make reasonable estimates for the fence distances and heights. And oh what fun that was.
So, how does it really compare? The field dimensions listed for Target Field: 339 feet LF, 377 LCF, 404 CF, 367 RCF, and 328 RF, do not compare well to the Metrodome’s dimensions: 343, 385, 408, 367, and 327 respectively. However, that is just five points in a 90 degree arc. Plus, the listed dimensions for the Metrodome are wrong. 343, 408, and 327 are right (probably). 385 and 367 though? Hah! I think a picture tells the story best:
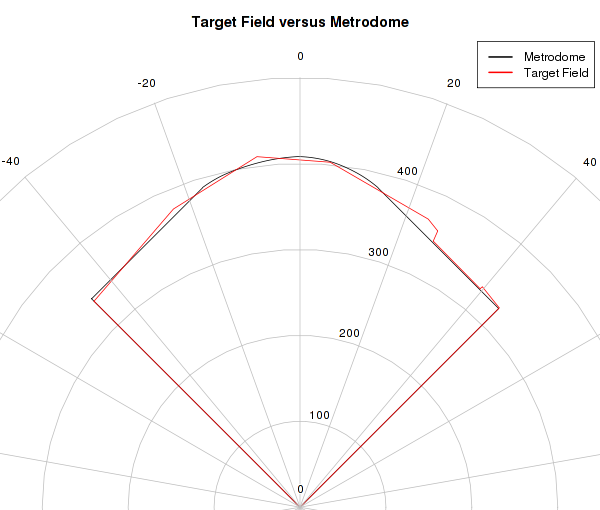
Not quite the obvious hitter’s park now. Also, all graphs and measurements use the above coordinate system. That is, -45 degrees down the left field line, 0 degrees to straightaway center, and 45 degrees down the right field line.
The main reason for the confusion are the angles used for measuring LCF and RCF are not the same between the two parks. For instance, the 367 occurs at 18 degrees in the Metrodome but 24 degrees in Target Field.
Are my measurements correct though? I have no idea. Lots of careful measuring of Target Field’s seating chart, looking at the 3D seat finder, and comparing to Andrew Clem’s Metrodome diagram lead me to think that my measurements are at least close.
But wait! I have more!
From the beginning of April through May 8 and from September 26 through October, the average high is less than 68 degrees1. That is approximately the lowest temperature I have seen posted for games at the Dome. This is important because colder air is denser and thus fly balls do not travel as far. Also, since the majority of games are played at night, there should be many games with a starting temp below 68 degrees (the average low in Minneapolis tops out at 64).
Starting with a windless 70 degree day, since that is environment the Metrodome always has, we get a home run percentage like so:
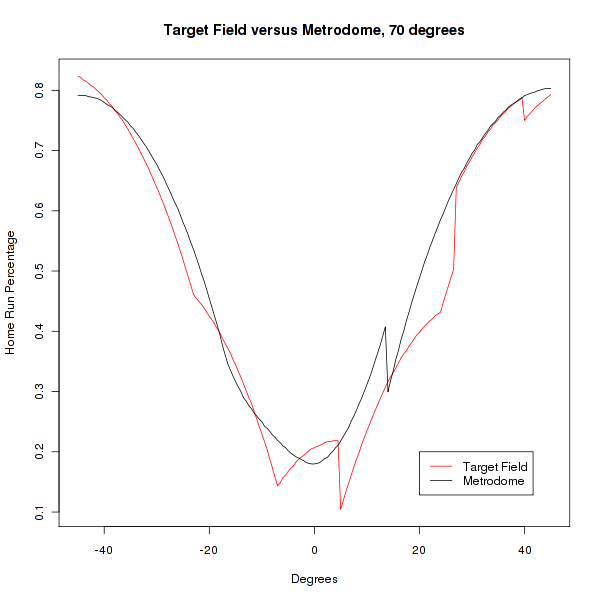
Quick, guess what those two drops in the 0 to 20 degree area indicate! I can wait. Meanwhile, I will give you my procedure.
After mapping out the fence distances and heights, I analyze the fence at every half a degree (-45, -44.5, …). To do this, I generate a large number of potential home runs. Every direction gets the same set of trajectories. The set consists of balls with an initial velocity between 90 and 108 mph, in increments of 0.2 mph, and an angle above the horizontal between 22 and 38 degrees, in increments of 0.5 degrees, for a set size of 3003. Then I just map out the trajectories for every ball in each direction and compare them to the fence distance and height. And now that I think about it, because I ignore wind this could have been much quicker if I just stored the trajectories for each ball in the set and reused them for each direction. Oh well.
Anyway, back to the original question: They are caused by the wall growing to 23 feet. Right now I think I have the baggie a bit smaller than it should be, but I lack appropriate pictures to determine where it ends. Something to do for part 2.
Eyeballing it I would guess that Target Field, on a calm, 70 degree day, will have fewer home runs on average than the Metrodome. Now, there is the problem of less foul territory (hm, part 3 maybe!), meaning fewer chances at a free out and longer at bats will even the difference.
But, sadly, we cannot have six months worth of beautiful 70 degree baseball days. I know, I wish too. Here is a graphsplosion of game time potential temperatures:
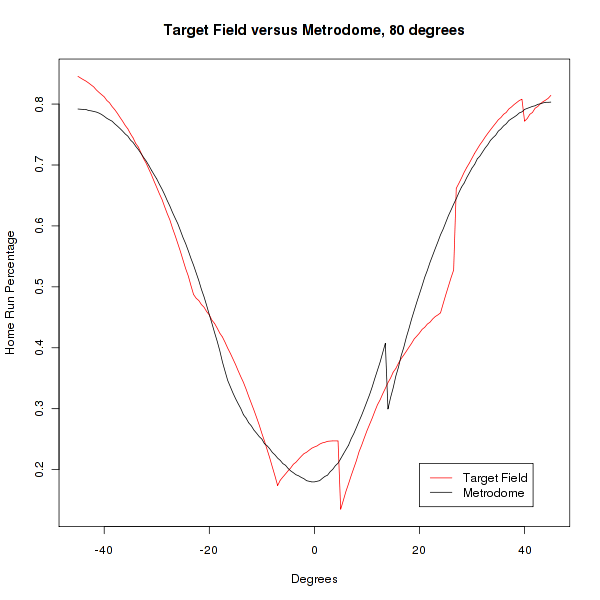
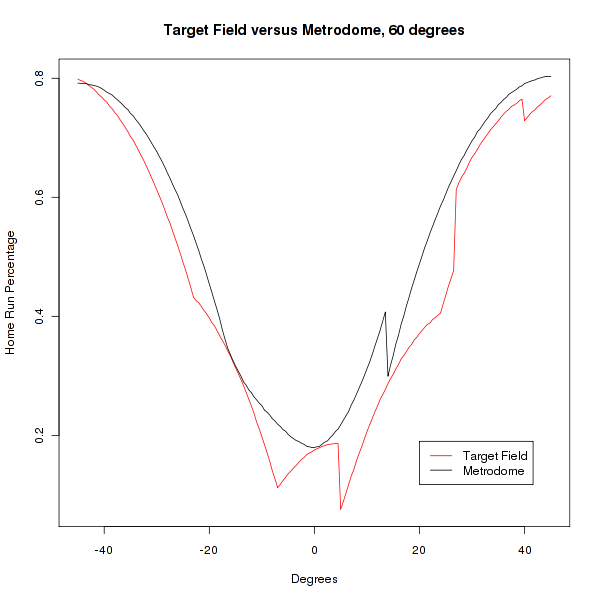
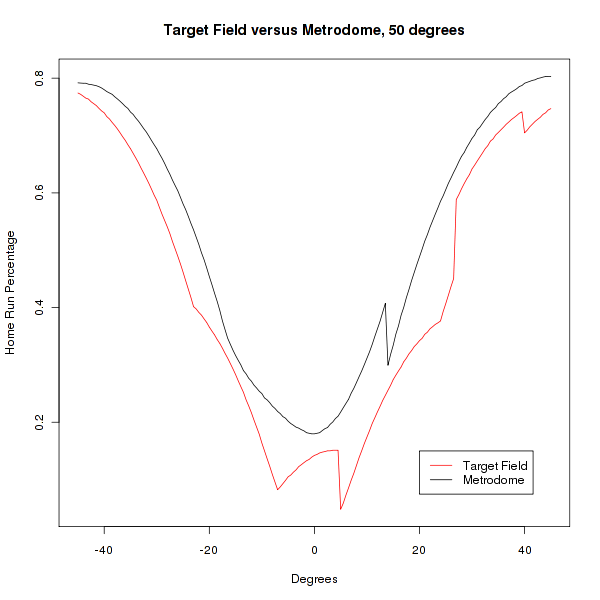
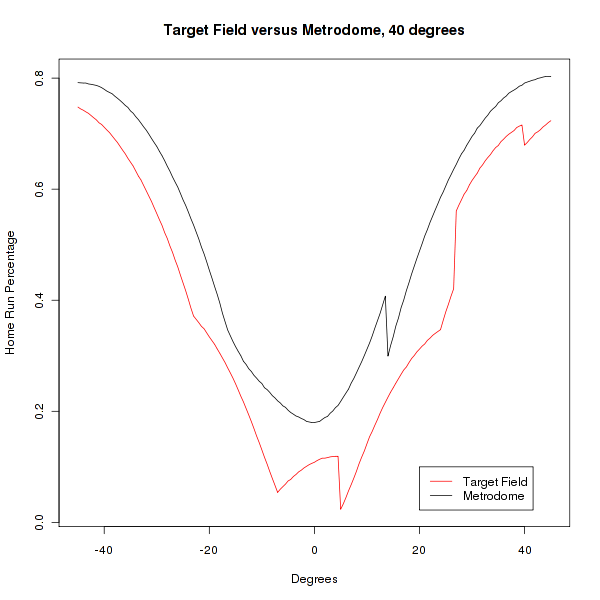
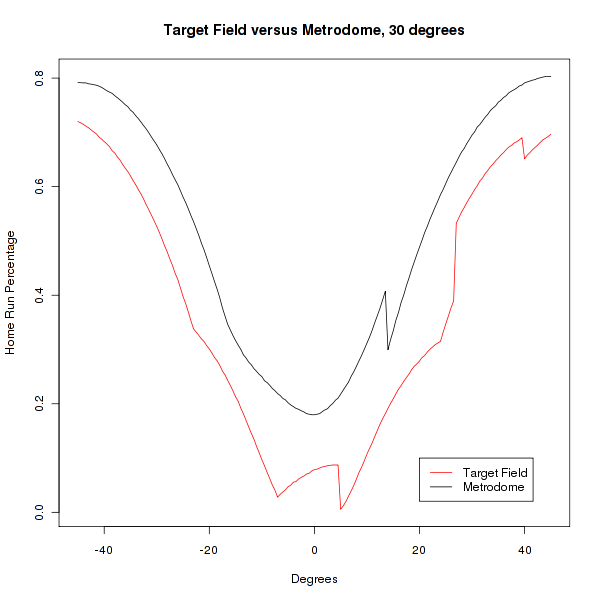
The same caveat of the first graph applies here as well: these all assume no wind. I need something for next week after all.
This could/will be quite the pitcher’s park when it gets cold. Also, if you have an itch to watch some Rangers or Rockies-style baseball, those humid 80+ degree days could be promising.
Finally, some numbers. This is the total number of balls that I estimated would be home runs for each temperature. The total number of trajectories considered was 543,543.
| Temperature | Metrodome | Metrodome Percentage | Target Field | Target Field Percentage |
|---|---|---|---|---|
| 80 | 278926 | 51.3% | 276738 | 50.9% |
| 70 | 278926 | 51.3% | 262673 | 48.3% |
| 60 | 278926 | 51.3% | 247862 | 45.6% |
| 50 | 278926 | 51.3% | 232317 | 42.7% |
| 40 | 278926 | 51.3% | 216279 | 39.8% |
| 30 | 278926 | 51.3% | 199763 | 36.8% |
How do you feel about Target Field now?
1: According to wunderground.com. All weather data from this site.
The Metrodome model was based entirely on the diagram created by Andrew Clem. The Baseball Trajectory Calculator from Alan Nathan’s page was invaluable for the drag and Magnus force equations.