Projecting Target Field 2010: Part 2
This is a day later than I wanted, but Tuesday is okay too right? Continuing from Part 1, this time I evaluate how Target Field’s fences will play with the wind and temperature.
To do this, I grabbed 14 years (1996-2009) worth of daily weather records for the period April 1 through October 10 from KMSP at weatherunderground.com and parsed it. I recorded average temperatures for a 1 PM and 7 PM game (I assumed a three hour game) along with the average wind speed and wind direction for every day. I then coalesced them into a single average for every calendar day; i.e. April 1 from 1996 through 2009 into a single April 1. I actually had the data early in the project but chose to do other things because I thought it would be challenging to get all the data crunched. Nope. It turned out to be quite easy and fast.
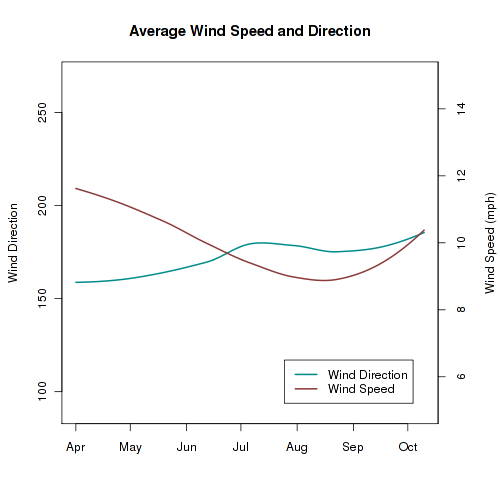
The mean direction from which the wind blows is kind of boring. Always from the south. I do find it interesting that the wind speed declines through August and then increases through September and October. Not a meteorologist though, so I have no idea why. Much of this post will focus on the averages I recorded, but I will be sure to include some of the more extreme possibilities as a “what if” at the end.
Now for some temperature curves.
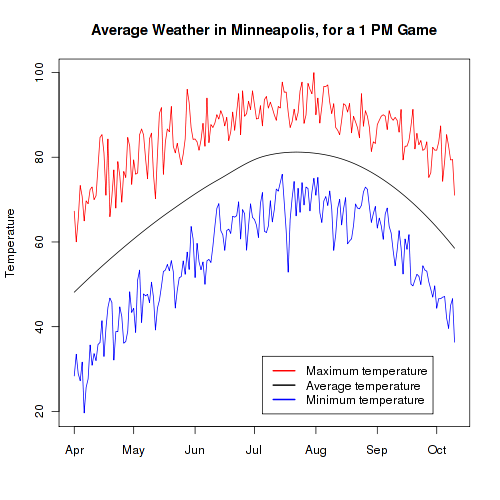
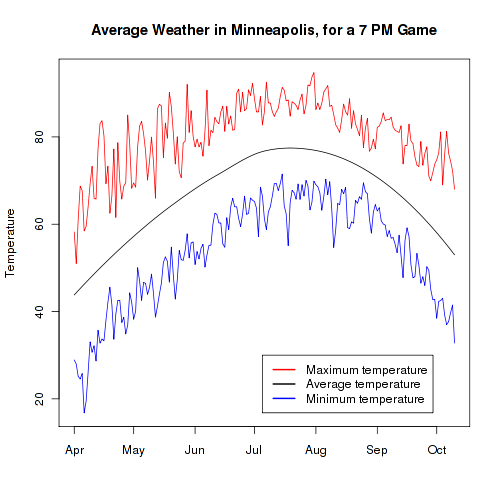
I did not smooth the minimum or maximum because I wanted them to be more representative of the temperature variation that happens. I would have put them in one graph, except the temperatures are so similar it would have been a mess. Besides, the graphs make the article look longer.
For the overall average of how the field will play, I took the monthly average for the wind speed and direction plus the temperature of a 7 pm game. Splitting it by the calendar months is entirely arbitrary, but I figure people will generally view the park as performing a certain way each month rather than every day being unique. Here are the results.
| Month | Temperature | Wind Speed | Wind Direction | Home Runs |
|---|---|---|---|---|
| April | 50.5 | 11.4 | 159.5 | 105225 |
| May | 62.7 | 10.7 | 163.5 | 129849 |
| June | 72.1 | 9.9 | 171.4 | 158760 |
| July | 77.1 | 9.2 | 179.3 | 181601 |
| August | 74.5 | 8.9 | 176.2 | 176548 |
| September | 65.1 | 9.4 | 178.0 | 160660 |
| October | 55.6 | 10.2 | 183.7 | 147953 |
| Metrodome | 70 | 0 | 0 | 271333 |
Wind direction is the origin of the wind; so 180 degrees is a breeze coming from the south. If you take a look at how the park is oriented, yes, that southerly breeze makes right field very tricky to reach.
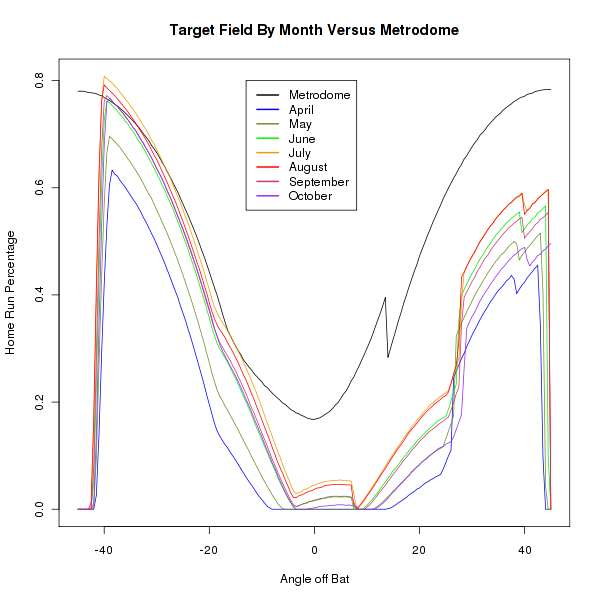
Well then. Mauer suddenly got all of this opposite field power this year and now we know why. He got the projections of how the park will play (a while ago of course) with the prevailing winds and orientation and realized that being the usual lefty that pulls pitches to right field simply would not work at Target Field. And 2009 is when he finally perfected hitting them to left field. Plus, since all but one of the left field home runs were at least five degrees away from the foul pole, the wind will help these balls since they will be pushed slightly to where the fence is shorter. Provided he tries after the first week or two of May. April hates home runs.
Now, this is all nice for the average of what will happen, but the temperature fluctuates from day to day and the wind even more so (the graph was a mess). How does the park play then? To get a rough idea, I took a hot (80 degrees Fahrenheit) and cold day (40 degrees), three different wind speeds (6, 14, and 18 mph), and the three directions not well represented above: north, east, and west. Then mooshed them together for 18 different days and crunched the numbers. Too many days to display how the field will play in one graph, so you get a boring table of data:
| Temperature | Wind Speed | Wind Direction | Home Runs |
|---|---|---|---|
| 40 | 6 | North | 250932 |
| 40 | 14 | North | 298950 |
| 40 | 18 | North | 317419 |
| 40 | 6 | East | 151866 |
| 40 | 14 | East | 94661 |
| 40 | 18 | East | 77198 |
| 40 | 6 | West | 256151 |
| 40 | 14 | West | 309421 |
| 40 | 18 | West | 329652 |
| 80 | 6 | North | 304533 |
| 80 | 14 | North | 341158 |
| 80 | 18 | North | 355601 |
| 80 | 6 | East | 213364 |
| 80 | 14 | East | 143332 |
| 80 | 18 | East | 116345 |
| 80 | 6 | West | 309237 |
| 80 | 14 | West | 350357 |
| 80 | 18 | West | 366408 |
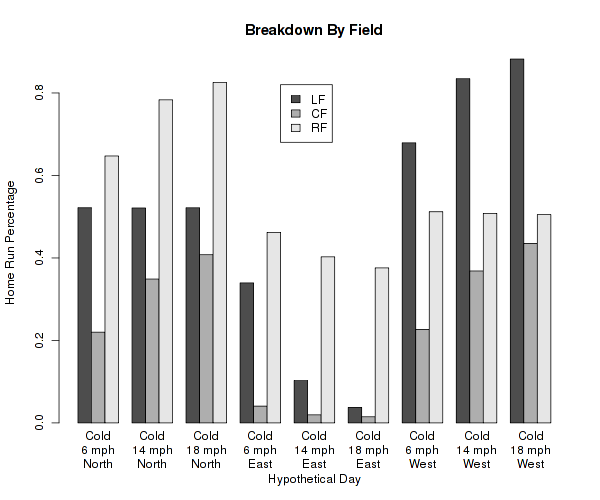
That is kind of hard to compare though. But rather than break it down like usual, I opted for some bargraphs. I split the field into LF, CF, and RF. LF is [-45, -15), CF is [-15, 15], and RF (15, 45]. This makes centerfield slightly larger for number of data points, but I think that is proper since centerfield is the harder defensive position.
First the cold days:
Now the hot days:
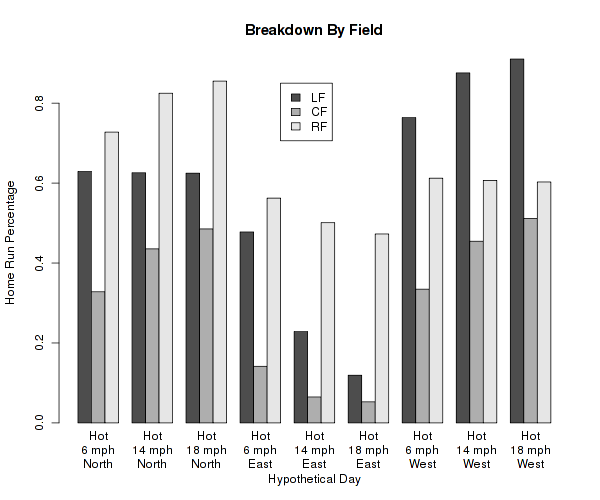
Although I originally expected a wind blowing from the north to help the most, a western wind actually does. Of course, with the shorter fence distance and height in left field, I should have known better.